Page Rendering Cycle - the optimization guide


Note: The contents of this article correspond with a speech given by Michał Dziubek at the Meet.js Meetup in Białystok. You can watch the full recording with English subtitles below.
- What is the page rendering cycle?
- Basic mechanics of page rendering
- Why should developers care?
- Common strategies for smoother layout phase
- Tracking the rendering cycle with DevTools
- Common pitfalls in page rendering cycle
- 1. Forced synchronous layout
- 2. Too intrusive/too frequent manipulation of DOM
- 3. Excessive use of JavaScript
- 4. Too many “expensive” CSSs
- Implementing performance improvements
- Modifying JavaScript for faster rendering
- CSS performance: strategies for smooth visuals
- Bonus section - working with Stacking Context
- Final thoughts
- 1. Business value is not the only thing that’s important
- 2. Don’t go too hard on the browser
- 3. Question and test everything
- 4. Sometimes more code is better
Page rendering cycle is a crucial, yet often misunderstood aspect of web development. It's the fundamental principle behind every website’s existence. Process that makes them functional and responsive, but its complexity can cause confusion. This article aims to clear that up.
First, we'll define what the page rendering cycle is and discuss its challenges and stages. We'll use DevTools to examine how we can track and understand this cycle. We'll also highlight the common issues developers encounter during this process.
Next, we'll examine how daily tasks, specifically those involving JavaScript (JS) and Cascading Style Sheets (CSS), influence the rendering cycle. Practical examples will be used to illustrate these points.
Later, we'll take a look into the 'stacking context', discussing its importance and how it impacts the rendering cycle.
By the end of this article, you should have a solid understanding of the page rendering cycle and how it influences your work as a developer.
Let's get started.
What is the page rendering cycle?
In its essence, the page rendering cycle is a multi-step process that transforms your code into a vibrant, interactive user experience. But what goes on behind the scenes to turn lines of code into a fully functional webpage?
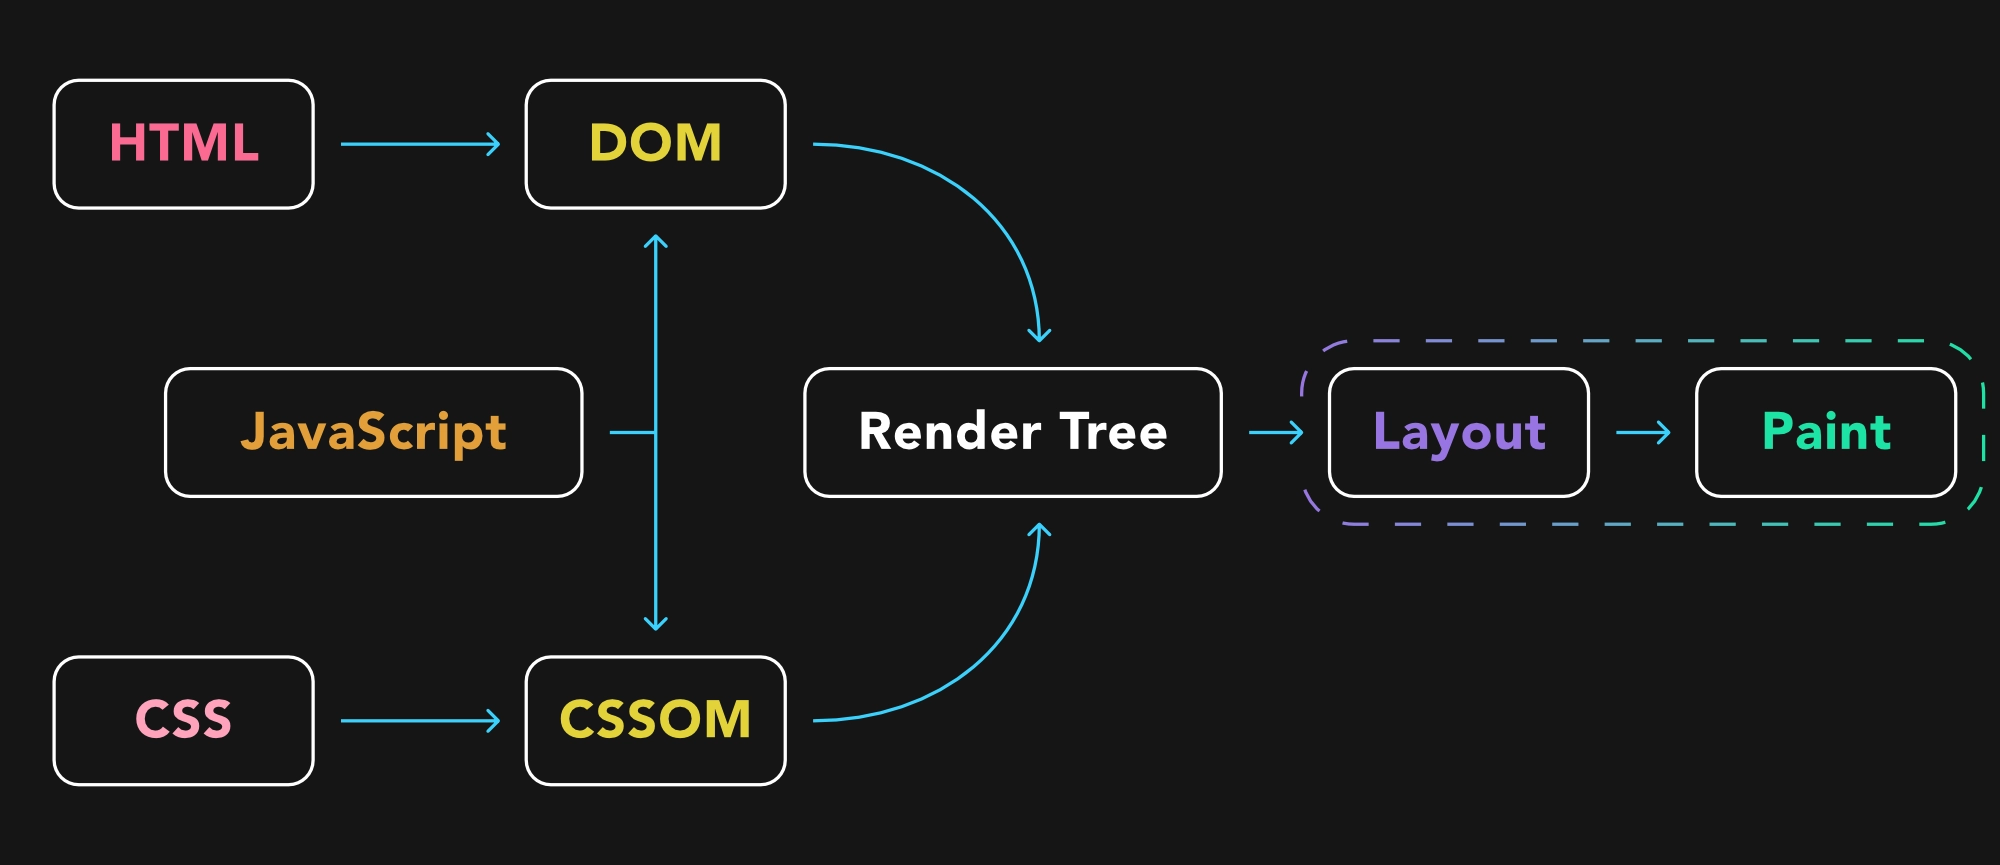
The rendered content that end-users interact with in their browser is the result of three primary components working together: HTML, CSS, and JavaScript (JS). HTML, the page markup, forms the structure of the webpage. CSS takes care of the aesthetics, determining how the elements on the page appear. JavaScript enables users to interact with the page beyond passive viewing.

However, JavaScript does more than just user interaction. It's also a fundamental part of the browser architecture, playing a key role in the creation of two essential objects: the Document Object Model (DOM) and the CSS Object Model (CSSOM).
Created from HTML and CSS respectively, these two models are not only hierarchical structures representing HTML and CSS, but they're also sets of APIs. These APIs allow for dynamic modifications to the webpage's structure and styling. In simpler terms, the DOM and CSSOM provide a map of how elements on the page are connected and styled. JavaScript can use this map to dynamically alter the appearance and behavior of these elements.
Basic mechanics of page rendering
With the Document Object Model (DOM) and CSS Object Model (CSSOM) in place, the browser can create what's known as a render tree. This tree serves as a set of instructions for the browser, dictating what elements need to be displayed on the page and how.
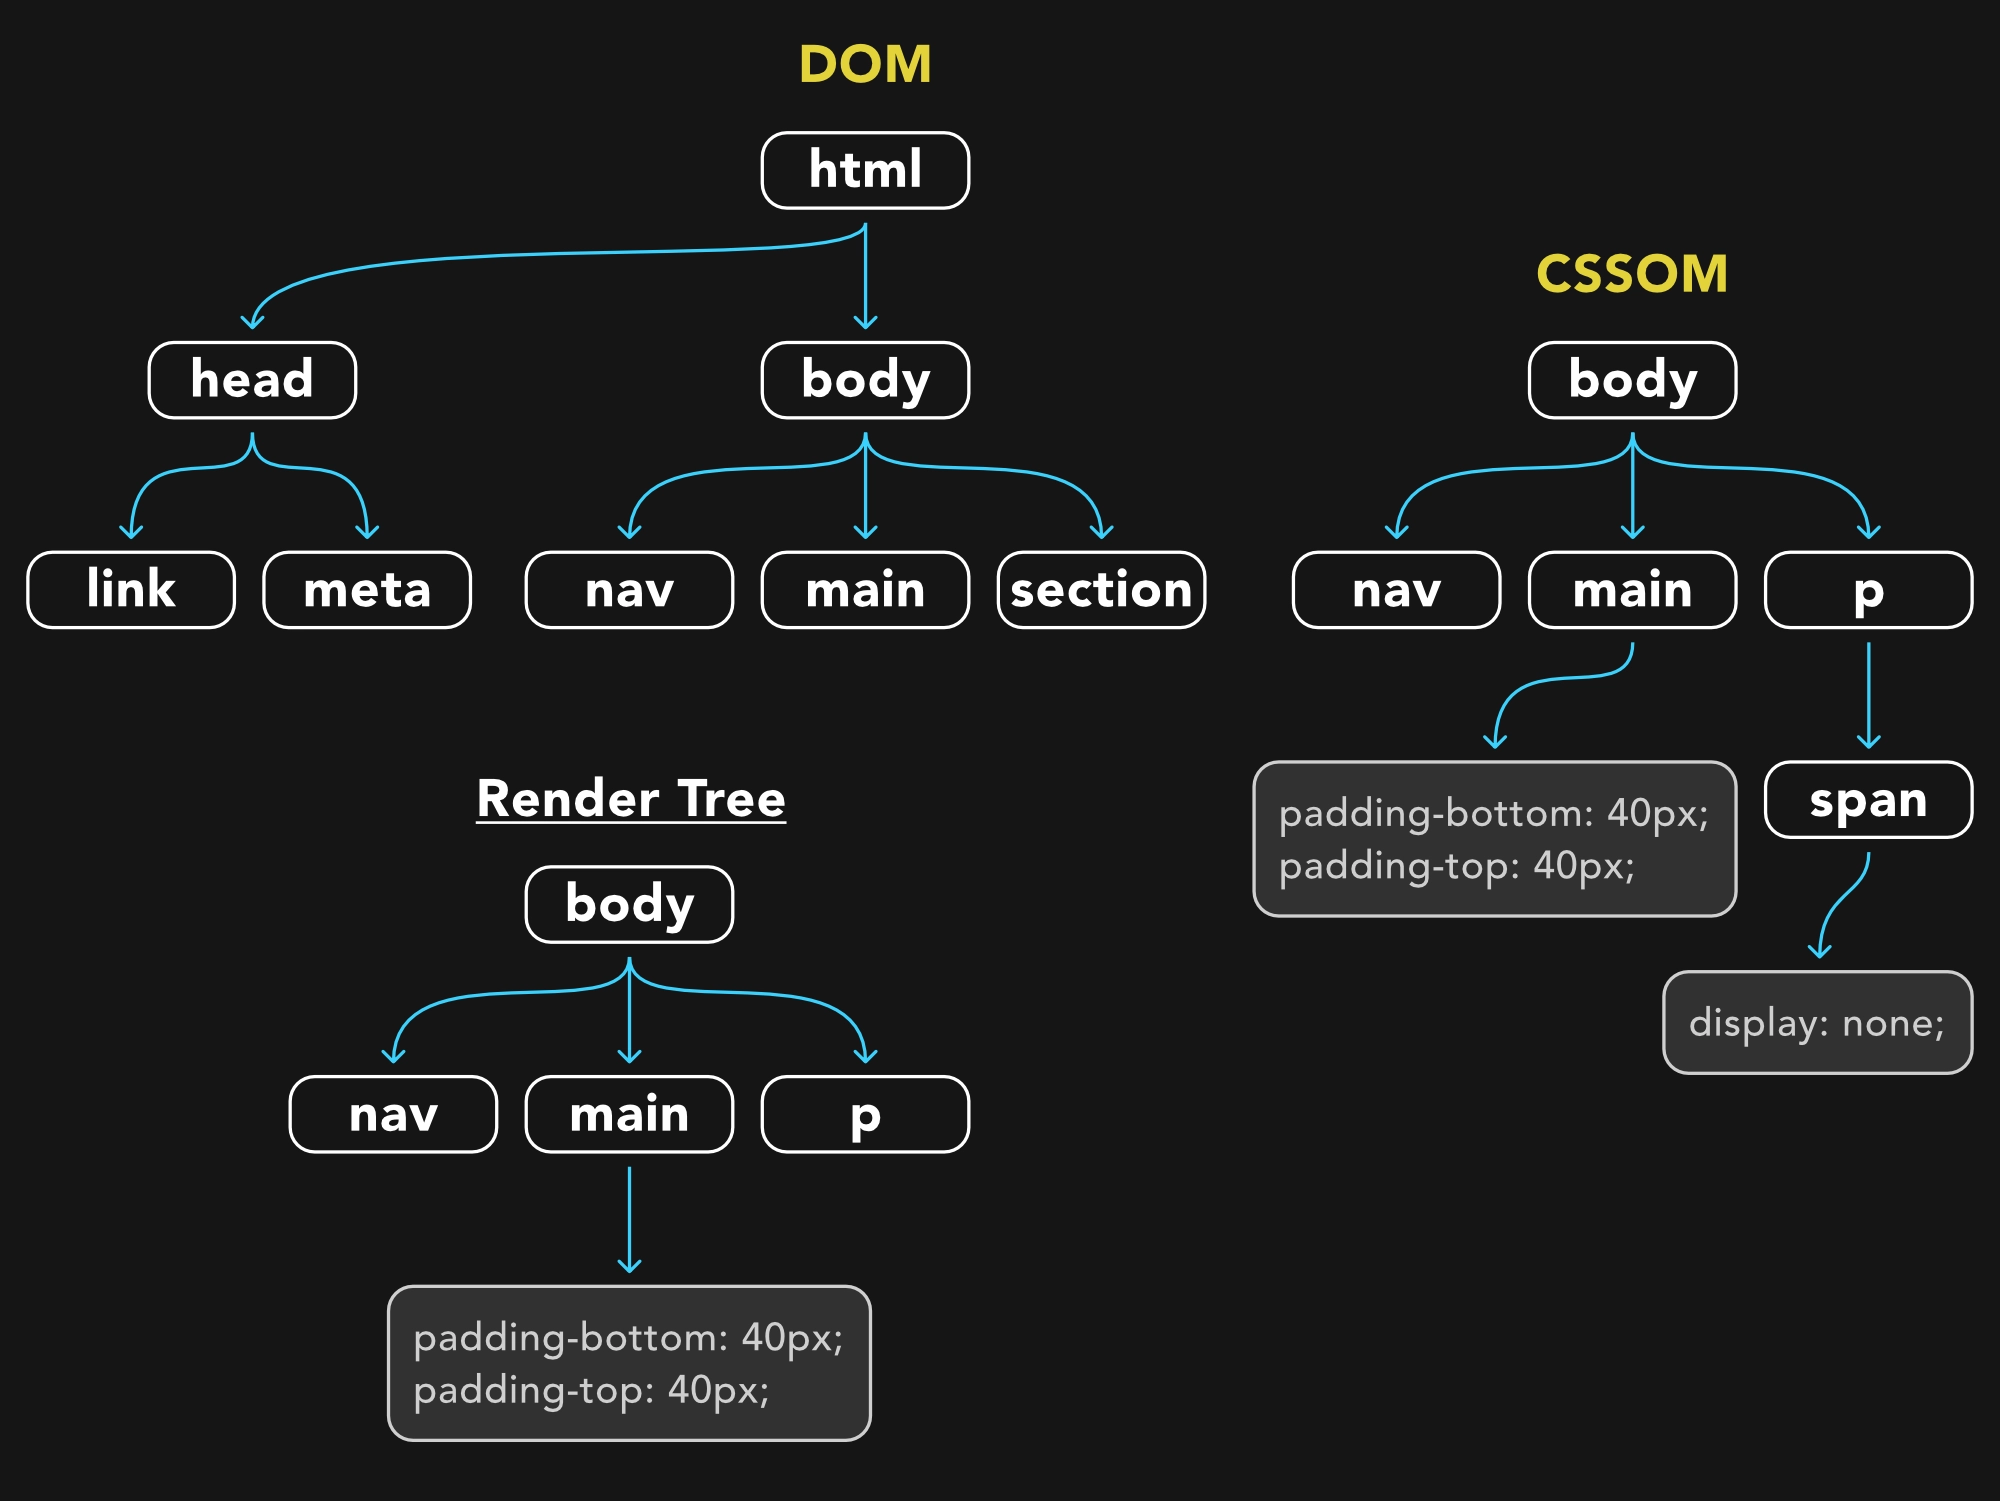
Once the render tree is ready, the browser initiates the layout phase of the rendering cycle. This phase is crucial as it determines the geometry of the webpage - the dimensions and positions of all the elements. After figuring out where everything needs to go, the browser proceeds to the paint phase. This phase involves drawing the calculated changes onto the page and applying the pixels - essentially creating the visuals that the users see on their screens.
Interestingly, the rendering cycle also includes a hidden phase called the 'style' phase, where the browser calculates the styles for each element. This phase is tucked away under the render tree creation process in most diagrams.
However, the rendering cycle is more intricate than that. If we dig deeper into DevTools, such as those offered by Chrome, we can observe a more detailed breakdown of the process. The performance tab in DevTools reveals additional phases, such as the 'Layerize' event, where the page is split into layers. Each of these layers contains a limited number of elements, much like layered canvases overlaid in three dimensions. This process is an optimization method employed by the browser to make the rendering process more efficient.
Another event, 'Prepaint', signifies the final preparations for painting elements onto the page. 'Composite' is another event that was visible in older browsers. In this phase, the layers that were separated during the 'Layerize' event are merged back together to form the final image. Finally, the 'Commit' event represents the browser's decision that it has everything it needs to render the frame, signifying that it's ready to show the page to the user.
As you can see, the rendering cycle is a complex, multi-stage process that involves calculating styles, layering elements, painting the page, and merging everything together for the final display.
Why should developers care?
You might be wondering, why is understanding the page rendering cycle so important? Does it really make a difference to our everyday work as developers? The answer is: yes, absolutely.
The concepts we’ll discuss in a moment are not revolutionary secrets that instantly boost page rendering or dramatically increase your Lighthouse scores. However, understanding the rendering cycle is critical for any professional frontend developer.
Think of it this way: web performance is a vast field, but the rendering cycle is one of the few aspects that developers can directly influence in their everyday work.
It goes even further - we influence it even when we're not conscious of it. Understanding how this process works can help us become more mindful developers. It encourages more intentional coding practices, boosting our effectiveness and productivity.
Improvement in site performance is an added advantage here. With a solid understanding of the rendering cycle, we can create smoother animations and quicker page responses. Depending on the specifics of the project, this can also result in better Lighthouse score.

This, in turn, can improve your site's Search Engine Optimization (SEO) score, leading to better positioning in search results. This enhanced visibility can attract more users to your site, potentially boosting conversions. For instance, a user could discover your site due to its improved ranking and end up buying a product.
Common strategies for smoother layout phase
You might have previously used properties like `offsetWidth`, `offsetHeight`, `getComputedStyle()`, or `scrollTop` in your code. They all share a common trait: they force the Layout phase.
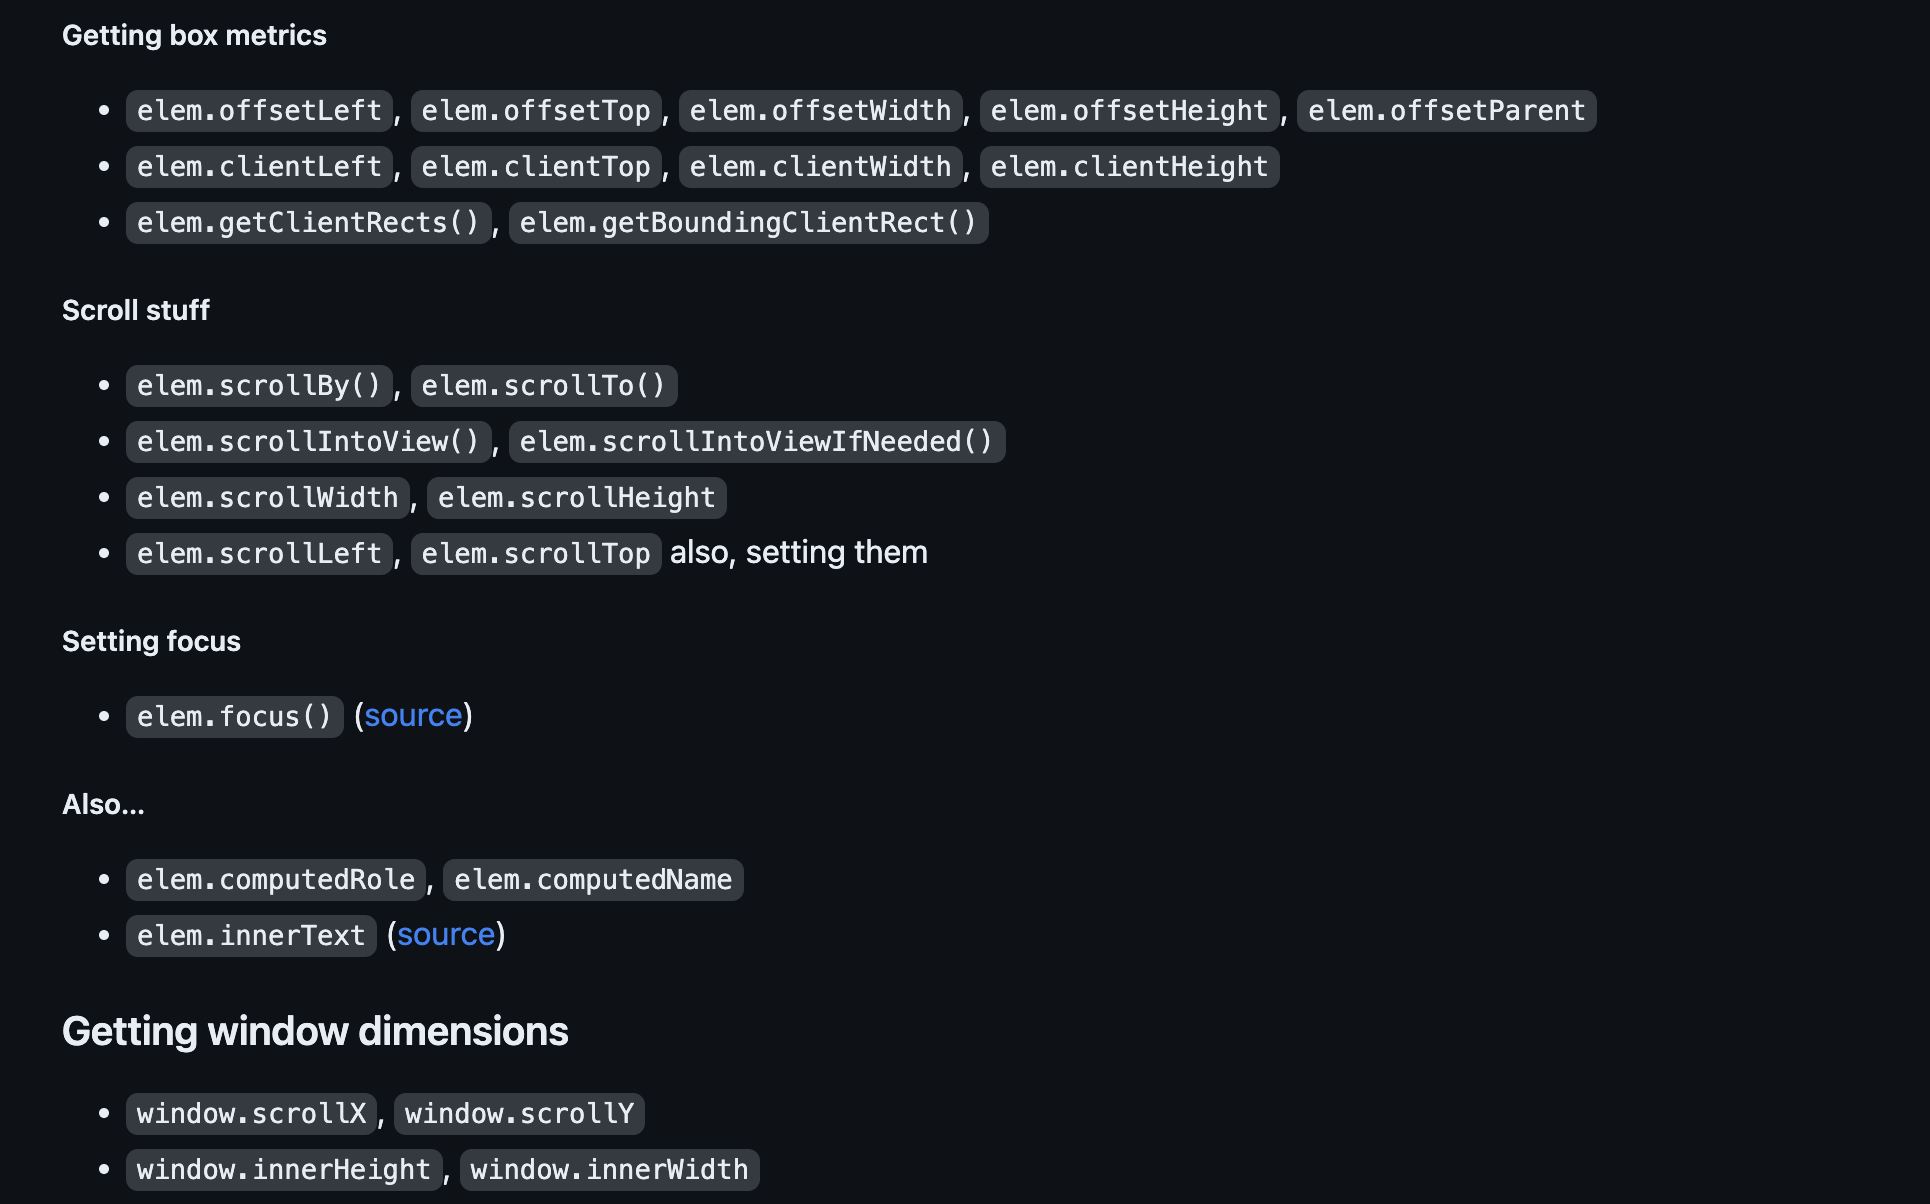
When we use these properties, we force the browser to recalculate the layout, to reconsider the dimensions and positions of elements on the site. It's quite likely that you use these methods frequently, perhaps even without being conscious of it.
There's a more comprehensive list of such properties available on GitHub - "What forces Layout?". This resource not only includes a variety of methods and properties that force the layout phase but also provides links to related articles and references to browser source code.
For instance, in the entry for the element.focus() method, the list provides a reference to the source code in the browser. This reference reveals that the use of 'element focus' indeed forces an update of styles and layout.
Tracking the rendering cycle with DevTools
Understanding the rendering cycle and how we influence it is only the first step. The next key aspect is being able to track the rendering cycle, for which we can use the browser DevTools. For this example, we'll be using Chrome's DevTools.

To begin, open DevTools in your browser. If you're using Chrome, you can find it under the More Tools option in the menu, or simply by right-clicking on your page and selecting Inspect. Once open, head over to the 'Performance' tab. Here, you'll find a 'Record' button. Activating this button initiates performance monitoring, recording all actions related to rendering.

The Record function can be triggered manually or with a keyboard shortcut, Command + E (for Mac users) or Ctrl + E (for Windows users). Next to the 'Record' button, there's another button that starts recording and simultaneously refreshes your page. After your page loads, stop the recording manually.

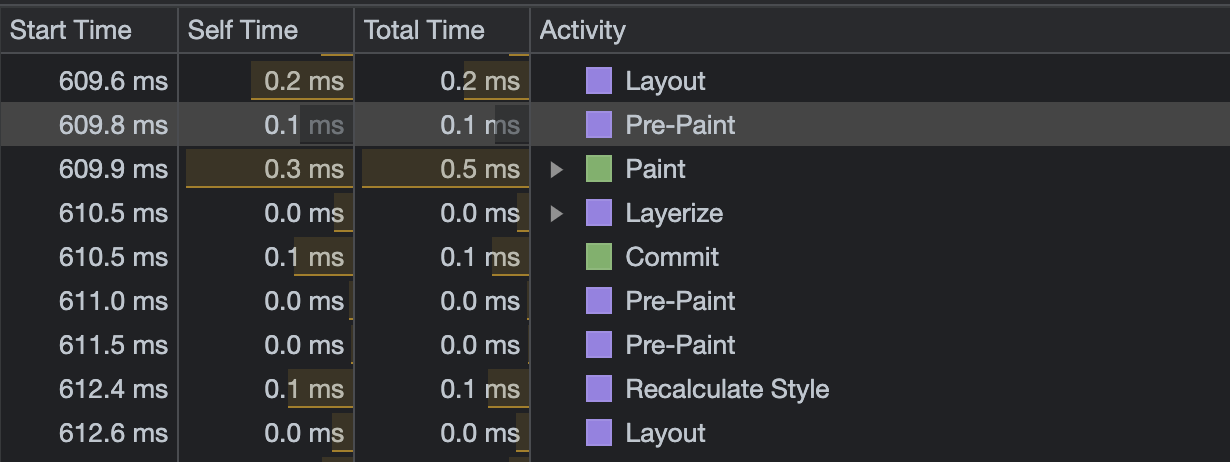
Now, let's inspect the rendering cycle. The generated view provides a wealth of data in the form of timelines, diagrams, and graphs. While this may initially seem overwhelming, don't worry; today, we're focusing mainly on the 'Main' line, which outlines the tasks performed by the browser.

As you look at the Main line, you'll notice events related to the rendering cycle. For instance, we can see 'Recalculate style', 'Commit', 'Pre-paint', and 'Layerize' events. These events provide insight into what is happening during the rendering process.

Pay attention to the colors used in these diagrams. The color coding is intentional: purple represents the Layout phase, while green signifies the Paint phase. This color-coding makes it easier to visually track the sequence and timing of these phases.

Here's what is happening in each.
LAYOUT PHASE
-
Style: compute final styles (stylesheets, inline, browser defaults)
-
Layout: calculate elements position and sizes
-
Layerize: break page into independent layers to update
-
Pre-paint: group of tasks related to paint phase preparation
PAINT PHASE
-
Paint: fill pixels for visible elements
-
Composite: combine layers into the final form visible on the screen
-
Commit: finalize and displaying, the final frame
Common pitfalls in page rendering cycle
Now that we are familiar with the Performance tab and know how to analyze the page rendering cycles, it's time to look at some of the most common problems linked with the page rendering cycle. Let's see what they are.
1. Forced synchronous layout
This occurs when we force the browser to re-render and trigger the Layout phase via certain methods or references. (Refer back to our GitHub list from a previous section for more context). Closely related yet distinct is "Layout Thrashing," which comes into play when we undertake numerous repetitive write and read actions performed on the DOM.
2. Too intrusive/too frequent manipulation of DOM
This is simply a bad practice. Keep in mind that the DOM is a hierarchical structure - a model, and when we frequently alter it, it must be constantly rebuilt. Think about a scenario where we want to add hundreds of elements to the DOM. If we add them one by one, it can overload the browser. While it might not cause some colossal lag users will notice, it all depends on the demand and scale.
A smarter approach here would be to create a virtual element, add all the required elements to this in memory, and finally append the whole element to the page markup. The problem can also come from nested DOM elements. If our markup is heavily nested, the entire Document Object Model will require intense recalculation.
3. Excessive use of JavaScript
Another common issue is the excessive use of JavaScript, for example to change styles that could be accomplished by simply altering a class and defining styles in CSS.
Using JavaScript to change so-called "inline styles isn’t the best practice, as it can lead to an overload of actions, leading to style recalculations.
Modern browsers are well optimized and nowadays they handle such cases much better than in the past, due to native, built-in optimization mechanisms. Hence the scale of issues related to such operations will depend on the complexity of the page structure and many other factors like: used browser, used properties, amount of affected nodes, etc. Nevertheless, dynamic inline styles manipulations using JavaScript should be avoided whenever possible.
4. Too many “expensive” CSSs
Some CSS properties are particularly resource-intensive to render, such as box-shadow or border-radius. Despite their popularity due to their aesthetic appeal, remember that these are expensive in terms of rendering cost.
Example CSS properties that are performance heavy:
-
border-radius
-
box-shadow
-
opacity
-
transform
-
filter
-
position: fixed
Other potential rendering traps include resources that block the page's rendering, like downloaded styles or scripts executed in the <head> of the page.
These block the parsing of the remainder of our document. We should avoid frequent use of external libraries, for instance, including a whole large lodash.js just to use a couple of its methods.
Implementing performance improvements
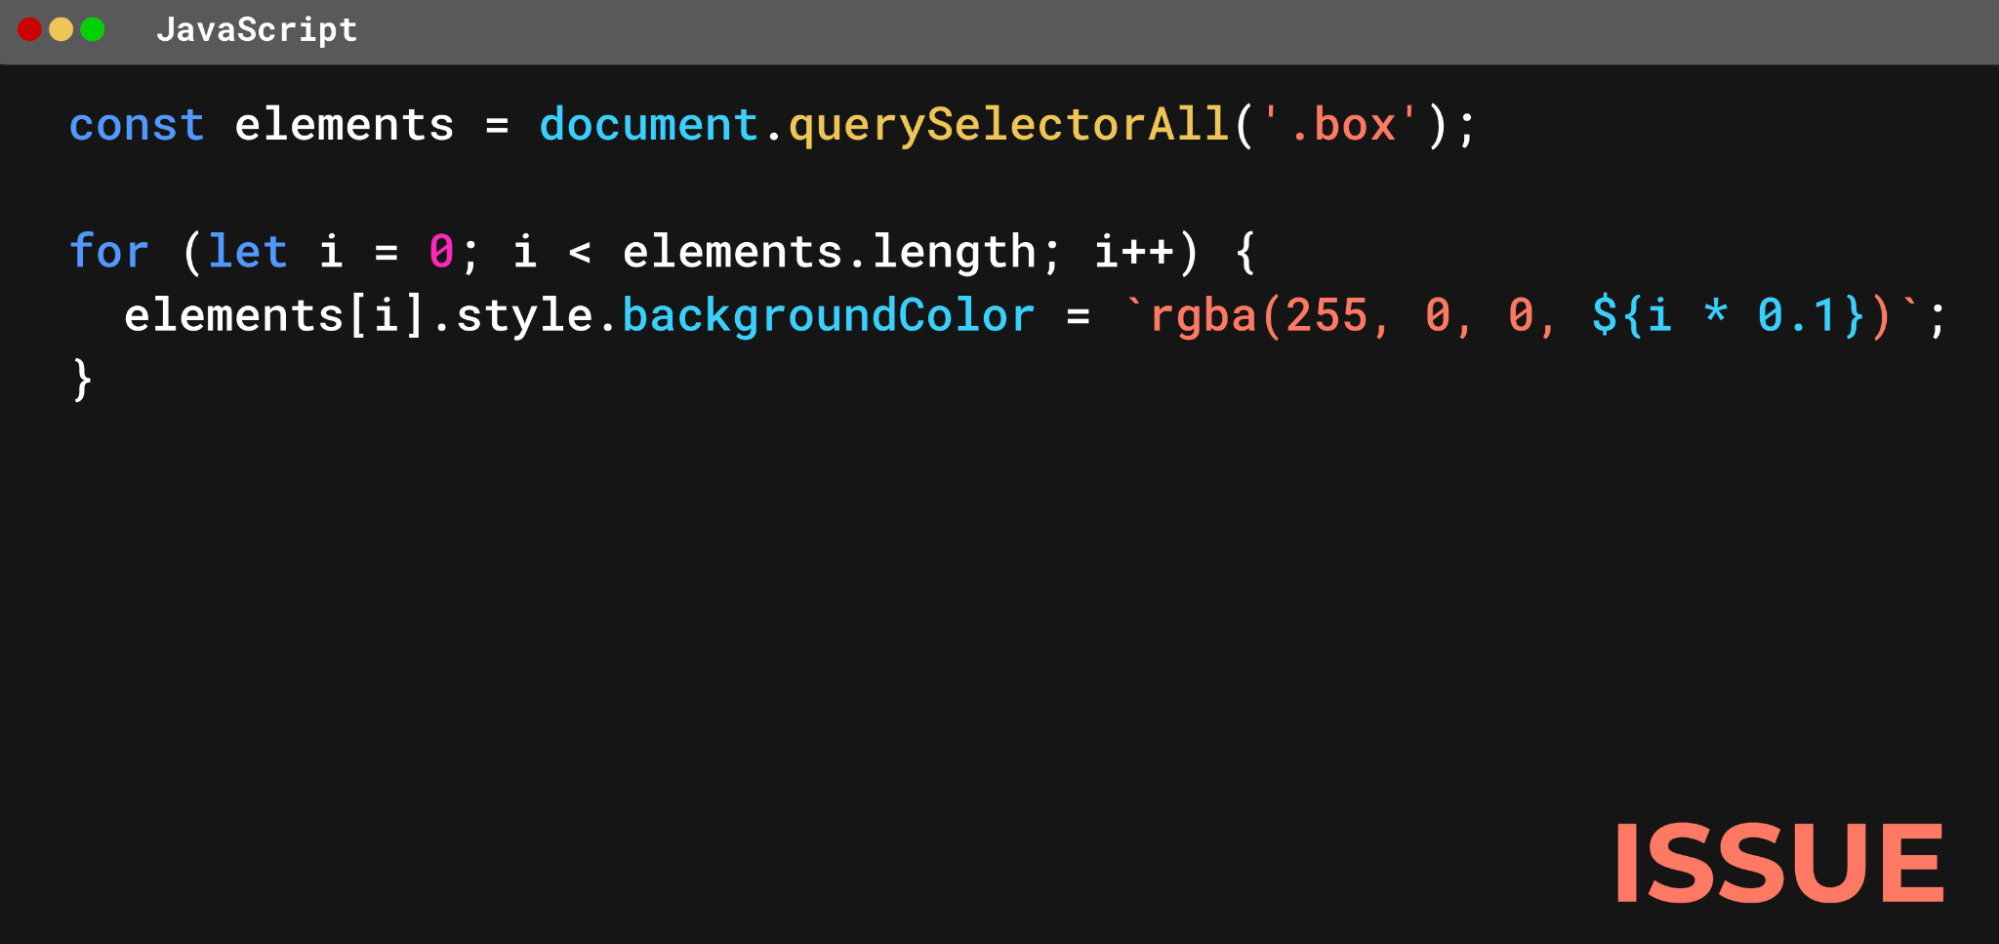
Now, let’s move to practical ways we could address those problems. Let’s look at this hypothetical situation.
We have several DIV elements with a '.box' class on a page. We use a query selector to access all of them. Then, in a loop, we fetch the width using the offsetWidth property (a burdensome layout property), and then we increase the width of each box by 10 pixels. Additionally all read/write actions are performed on DOM in an unorganised way, causing additional “Layout Thrashing”.
EXAMPLE SETUP:
HTML
<!DOCTYPE html>
<html lang="en">
    <head>
        <meta charset="utf-8">
        Forced synchronous layout / Layout Thrashing
        <link rel="stylesheet" href="styles.css" />
    </head>
    <body>
        <main>
            <section>
                <div id="box1" class="box"></div>
                <div id="box2" class="box"></div>
                <div id="box3" class="box"></div>
                <div id="box4" class="box"></div>
                <div id="box5" class="box"></div>
                <div id="box6" class="box"></div>
            </section>
        </main>
        <script src="scripts.js"></script>
    </body>
</html>
CSS
.box {
  height: 100px;
  width: 100px;
  border: 5px solid #000;
  background-color: #000;
  margin: 20px;
}

main {
  display: flex;
  justify-content: center;
  flex-direction: column;
}

section {
  margin: auto;
}
EXAMPLE OF UNOPTIMIZED CODE:
JS:
 const elements = document.querySelectorAll('.box');

  for (let i = 0; i < elements.length; i++) {
    const offsetWidth = elements[i].offsetWidth;
    elements[i].style.width = `${offsetWidth + 10}px`;
  }
On running a performance test in the browser, we find that for just six boxes, the browser had to execute the Layout action seven times in total, which is excessive.
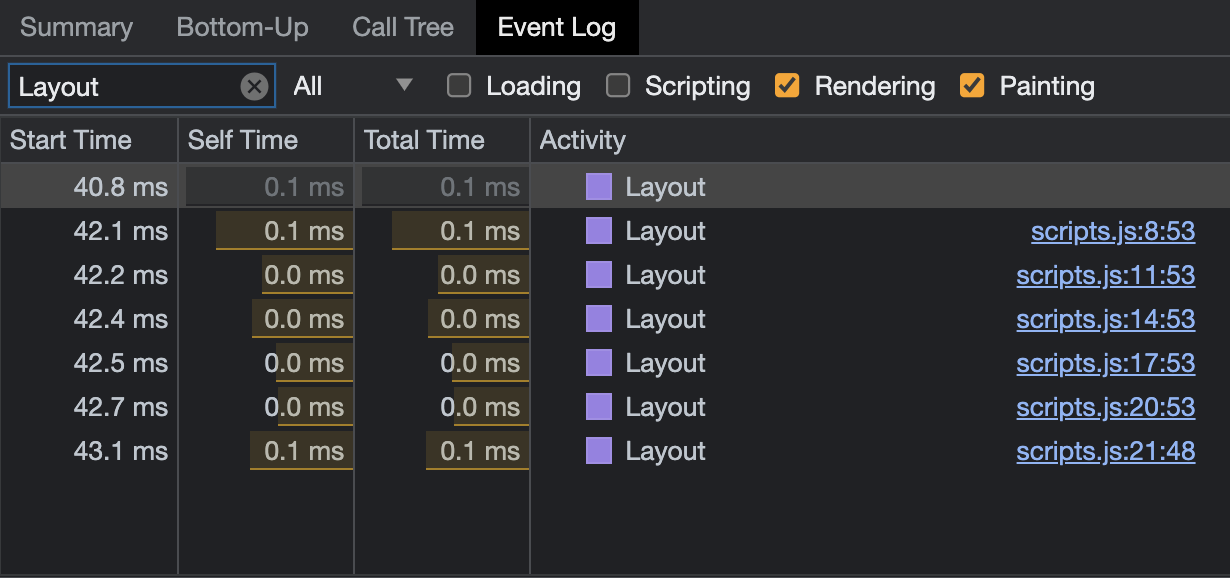
The question now is: Can we improve this?
Modifying JavaScript for faster rendering
In our initial setup, we repetitively fetched the widths of the elements and updated them. In a slightly optimized scenario, we could use an array to store the widths of these elements and then use the requestAnimationFrame() method to update the widths based on these stored values. The array usage is meant to organise all the read actions performed on DOM in one logical block to avoid mixing them up with write actions which might be the cause of “Layout Thrashing”.
OPTIMIZED CODE EXAMPLE :
JS Solution:
const elements = document.querySelectorAll('.box');
const widths = [];
for (let i = 0; i < elements.length; i++) {
widths.push(elements[i].offsetWidth);
}
requestAnimationFrame(() => {
for (let i = 0; i < elements.length; i++) {
elements[i].style.width = `${widths[i] + 10}px`;
}
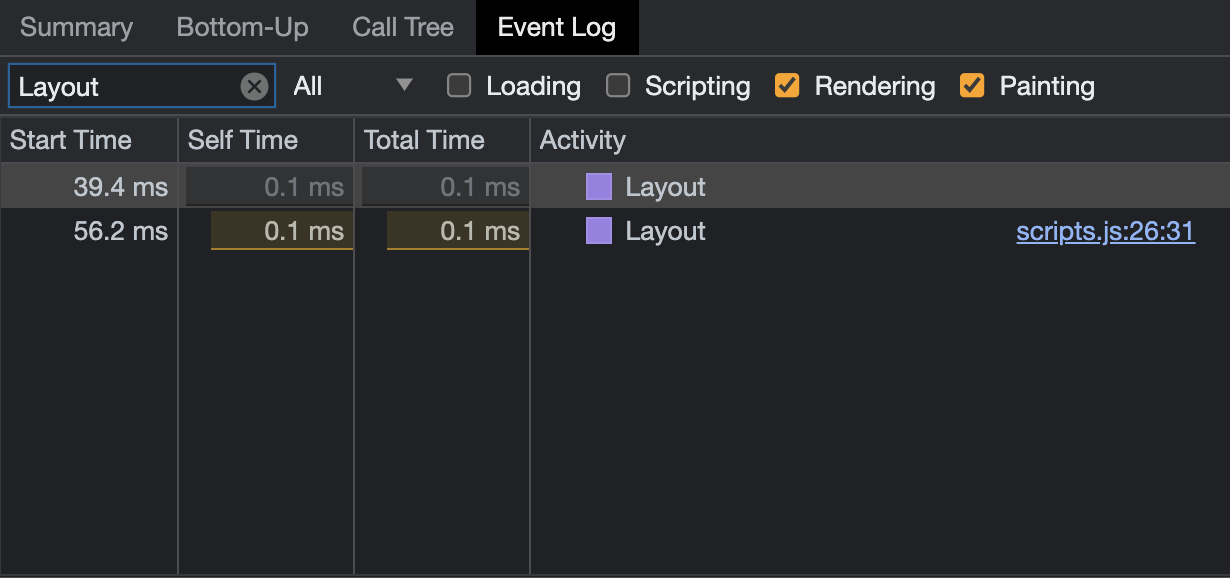
});When we execute the optimized code, the rendering performance significantly improves. Now, we have only two layout actions instead of several, which clearly shows the impact of the optimization. This improvement results from the browser not needing to repeatedly perform read/write operations. It fetches the widths all at once and stores them in an array. Then, in the `requestAnimationFrame()`, it gets these widths from the array and assigns them to the elements.
Please note that in this article, we are focusing on optimizations for the page rendering cycle, particularly on reducing the amount of excessive Layout and Paint actions. Splitting the initial, unoptimized code into two for-loops, where the second loop helps separate write to DOM actions from read actions, can sometimes be enough to significantly decrease the “Layout Thrashing” effect. However, this may also impact performance, depending on the number of nodes it must iterate through.
In a real-life scenario, we would perform benchmarks on real data to ensure that the gains from reduced Layouts/Paints are not offset by increased JS execution time.
The requestAnimationFrame() method is a browser-provided tool designed for optimizing animations. This method schedules the execution of a function or block of code to happen just before the next repaint of the page, thereby reducing the time between the calculations and their appearance on the screen.
The requestAnimationFrame() also has built-in optimization features. For instance, it can pause all the callbacks if the user switches to another tab, freeing up computational resources.
For those who want a deep-dive into requestAnimationFrame() and its influence on the page rendering cycle, I recommend Jake Archibald's presentation "In the Loop" at JSConf Asia. It will give you a comprehensive understanding of this method.
Moving on, let's examine another scenario - animations. Let's say we have a button and a box. When the button is pressed, we want to increase the width of the box to 300 pixels.
In the initial setup of the example, even though the 'requestAnimationFrame()' is used to perform the width change with JS, there still is a high number of Layout and Paint actions. However, by optimizing the code snippet to use JS only to change the class, and then triggering a CSS engine-performed animation, the number of Layout actions decreases significantly, almost by half.
EXAMPLE SETUP :
HTML
<!DOCTYPE html>
<html lang="en">
    <head>
        <meta charset="utf-8">
      Animating with JS only - demo
        <link rel="stylesheet" href="styles.css" />
    </head>
    <body>
        <main>
            <div class="box"></div>
            <button class="button">ANIMATE</button>
        </main>
        <script src="scripts.js"></script>
    </body>
</html>
CSS
.button {
  background-color: rgb(22, 2, 77);
  border: none;
  border-radius: 5px;
  color: #fff;
  cursor: pointer;
  font-size: 16px;
  font-weight: 700;
  height: 45px;
  margin-top: 20px;
  width: 200px;
}
EXAMPLE OF UNOPTIMIZED CODE:
JS
const button = document.querySelector('.button');
const box = document.querySelector('.box');

button.addEventListener('click', animateWidth);

function animateWidth() {
  let width = 100;

  const animate = () => {
      width += 1;
      box.style.width = width + 'px';

      if (width < 300) {
          requestAnimationFrame(animate);
      }
  };
  requestAnimationFrame(animate);
}
CSS
.box {
  background-color: red;
  height: 100px;
  width: 100px;
}
As you can see, the number of Layout/Paint actions becomes very high.

The reasoning behind the updates we're making is simple: by using CSS for animations, we move the heavy lifting from JavaScript. This move makes the browser's job of optimizing animations smoother, because the CSS engine is naturally better at handling them.
Of course there are JavaScript-powered animation engines and specific APIs, like the Web Animations API, that also do a good job with these tasks. But, in this article, we're focusing on common mistakes and how to fix them using basic methods, without leaning on any complex APIs for better performance.
OPTIMIZED CODE EXAMPLE:
JS
const button = document.querySelector('.button');
const box = document.querySelector('.box');

button.addEventListener('click', animateWidth);

function animateWidth() {
  box.classList.add('animate');
}
CSS
.box {
  width: 100px;
  height: 100px;
  background-color: red;
  transition: width 2s;
}

.box.animate {
  width: 300px;
}
With this change, we will be able to reduce the number of Layout/Paint actions by half.

Finally, a good practice to remember: when you use JS to set styles, you can end up with too many style recalculations, and in effect - inefficient rendering. Instead, consider using CSS variables or class-based styles. These practices can improve browser optimization significantly - especially on larger, more complex pages.
CSS performance: strategies for smooth visuals
After looking at how we can optimize with JavaScript, let's now switch our focus more to CSSs. Here we also have many opportunities to boost our page's rendering performance.
First, let's look at some properties that could be particularly performance-draining. Take for example, the `box-shadow` property coupled with a `transform`. If we set the `transition: all`, we're telling the browser to prepare for all property changes to be animated. When we run this and observe the Performance, we notice that there are only two Layout actions, but a substantial number of Paint actions, around fifty in this instance.
EXAMPLE SETUP:
HTML
<!DOCTYPE html>
<html lang="en">
    <head>
        <meta charset="utf-8">
        Expensive CSS properties - demo
        <link rel="stylesheet" href="styles.css" />
    </head>
    <body>
        <main>
            <section>
                <div id="box1" class="box"></div>
                <div id="box2" class="box"></div>
                <div id="box3" class="box"></div>
                <div id="box4" class="box"></div>
                <div id="box5" class="box"></div>
                <div id="box6" class="box"></div>
            </section>
        </main>
        <script src="scripts.js"></script>
    </body>
</html>
CSS
main {
  display: flex;
  justify-content: center;
  flex-direction: row;
}

section {
  margin: auto;
}
EXAMPLE OF UNOPTIMIZED CODE:
CSS
.box {
  display: inline-flex;
  width: 100px;
  height: 100px;
  box-shadow: 0px 4px 6px rgba(0, 0, 0, 0.1);
  background-color: red;
  transition: all 0.3s;
}

.box:hover {
  transform: scale(1.1);
  box-shadow: 0px 6px 12px rgba(0, 0, 0, 0.5);
}
We can optimize this snippet by making a small adjustment. Instead of indicating a `transition` for all properties, we explicitly mention transform and `box-shadow`, which we know will change. We also introduce the will-change property, alerting the browser that this element will undergo changes, thereby enabling better planning and optimization of the rendering process. It can even pull this element into a separate layer during the Layerize stage, reducing its concern for other elements.
OPTIMIZED CODE EXAMPLE:
CSS
.box {
  display: inline-flex;
  width: 100px;
  height: 100px;
  box-shadow: 0px 4px 6px rgba(0, 0, 0, 0.1);
  background-color: red;
  transition: transform 0.3s, box-shadow 0.3s; // This line changed
  will-change: transform, box-shadow; // This line added
}

.box:hover {
  transform: scale(1.1);
  box-shadow: 0px 6px 12px rgba(0, 0, 0, 0.5);
}
After these modifications, we see a significant improvement in performance - no Layout actions at all! This is because the browser was able to segregate this element into another layer, render it early, and during hover, simply arranges the layers in the right order during composition. This eliminated the costly Layout actions.
Next, let's dig into CSS animations. In this example, we animate the opacity property. The button changes color on hover, transitioning from blue to red. Let's observe the impact on the rendering cycle.

EXAMPLE SETUP:
HTML
<!DOCTYPE html>
<html lang="en">
    <head>
        <meta charset="utf-8">
        Meet.js - Example 2: Forced synchronous layout - demo
        <link rel="stylesheet" href="styles.css" />
    </head>
    <body>
        <main>
            <section>
                <button class="button">HOVER OVER ME</button>
            </section>
        </main>
        <script src="scripts.js"></script>
    </body>
</html>
CSS
main {
  display: flex;
  justify-content: center;
  flex-direction: row;
}

section {
  margin: auto;
}
EXAMPLE OF UNOPTIMIZED CODE:
CSS
.button {
  background-color: rgb(22, 2, 77);
  border: none;
  border-radius: 5px;
  color: #fff;
  cursor: pointer;
  font-size: 20px;
  font-weight: 700;
  height: 80px;
  width: 340px;
  transition: background-color 0.3s;
}

.button:hover {
  background-color: red;
}
As it turns out, there were no Layout actions, but quite a few Paint actions, around 40-50.

In the optimized snippet, we utilize the ::after pseudo-element to simulate the button's background colour. This element initially has opacity: 0 but changes to 1 on hover, revealing the background colour.
OPTIMIZED CODE EXAMPLE:
CSS
.button {
position: relative;
background-color: rgb(22, 2, 77);
border: none;
border-radius: 5px;
color: #fff;
cursor: pointer;
font-size: 20px;
font-weight: 700;
height: 80px;
width: 340px;
}
.button::after {
content: "HOVER OVER ME";
position: absolute;
border-radius: 5px;
color: #fff;
top: 0;
left: 0;
right: 0;
bottom: 0;
background-color: red;
opacity: 0;
transition: opacity 0.3s;
pointer-events: none;
display: flex;
align-items: center;
justify-content: center;
}
.button:hover::after {
opacity: 1;
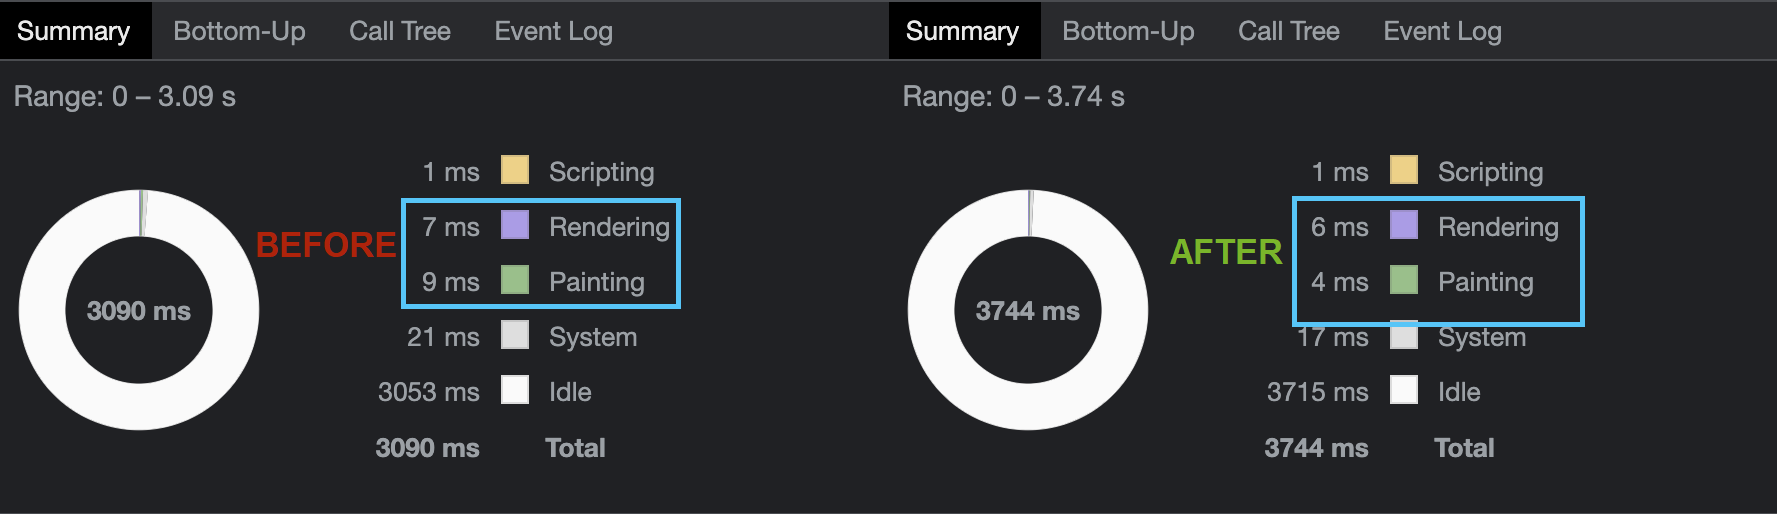
}Although it appears counterintuitive at first, this approach reduces the number of Paint actions to around 10. However, it introduced Layout actions which weren't present earlier.
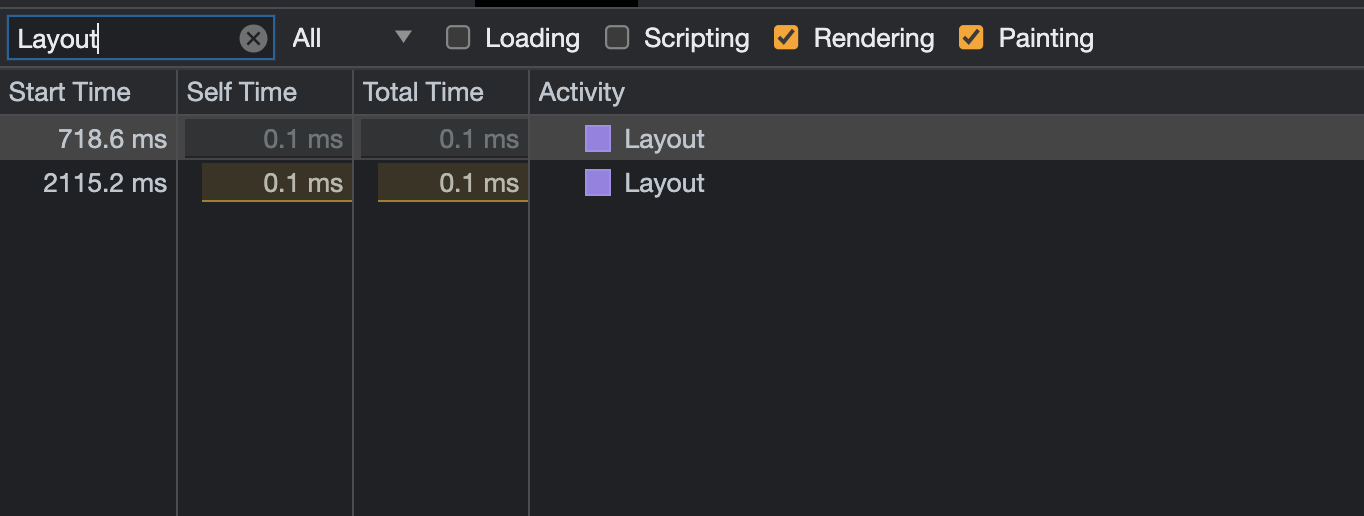
How do we decide which approach is more optimal? I recommend comparing the rendering times for Layout and Painting under the Summary tab. In this case, the total time sums were lower than before, indicating an improvement.
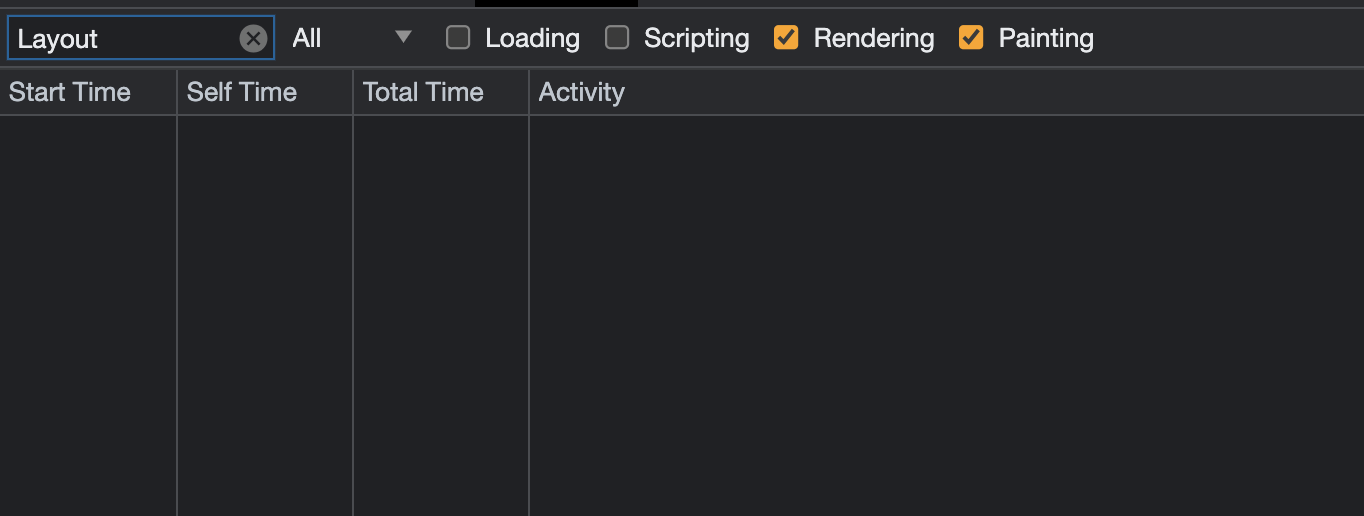
For one final optimization trick, let's add `will-change: opacity`; to the `::after` element to pull it into another layer. Post this change, we observe no Layout actions and no Paint actions - a seemingly magical optimization. This performance boost is achieved because the browser was better prepared, having the ::after layer rendered early, and by simply stacking it on top, it's ready to render this frame at the commit event.
This example showcases that unusual approaches sometimes tend to give very satisfying results, despite the oddity of the applied solution. Obviously, such an approach won’t be suitable for many real use cases and its main goal is to highlight how the code-level changes impact the process of rendering the web page by the browsers.
Bonus section - working with Stacking Context
Let’s now take a look at another crucial aspect of web performance optimization: the Stacking Context.
Stacking Context refers to the 3D conceptual hierarchy of elements on a webpage, dictating the order in which the browser renders dependent elements. Each root of the document (every <html> tag), creates its own Stacking Context. However, we can also establish a new Stacking Context using specific styles, such as:
-
`position: absolute/relative` with a `z-index` value not set to auto
-
`position: fixed/sticky` (mainly mobile browsers)
-
setting `opacity` to less than 1
-
elements that are children of a flex/grid `display` element with a z-index value not set to auto
also create a distinct Stacking Context.
You can find more comprehensive details on Stacking Context in this article on Developer Mozilla.
After introducing the concept of Stacking Context and having discussed layers before, you might wonder whether the two are the same. Unfortunately, that's not the case.
Not all Stacking Contexts must form separate layers. Layers are a browser optimization technique that helps speed up rendering by dividing elements into different layers. As a result, the browser only needs to repaint or re-render elements within a given layer without affecting others. Even so, we can enforce a new layer with the will-change property, or with a transform property using `translateZ(0)`.
Understanding and utilizing Stacking Contexts can be really helpful, as illustrated by an example from a developer Dzhavat Ushev. While conducting a performance check on his blog, he noticed that animating the header led to the re-rendering of other unrelated elements on the page.
(source:https://dzhavat.github.io/2021/02/18/debugging-layout-repaint-issues-triggered-by-css-transition.html. Credits to the author: Dzhavat Ushev)
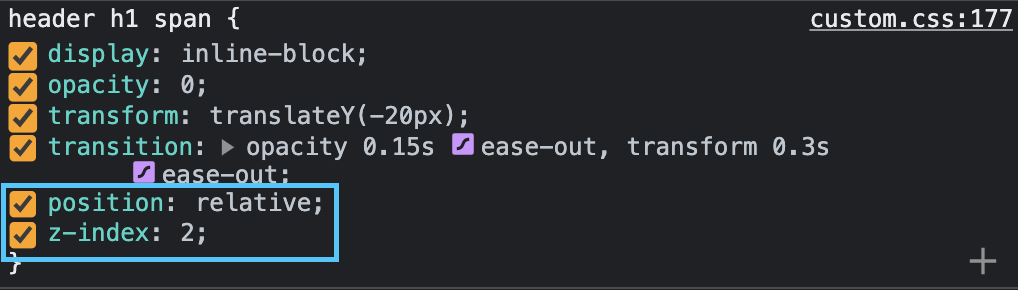
Upon further investigation, Dzhavat found out that all these elements were within the same Stacking Context, leading to their redundant rerendering. To prevent this, he enforced a new Stacking Context for the header using position: relative and `z-index 2`.
(source:https://dzhavat.github.io/2021/02/18/debugging-layout-repaint-issues-triggered-by-css-transition.html. Credits to the author: Dzhavat Ushev)
After this change, the header animation only led to the header's rerendering, leaving other elements unaffected. This example truly shows how powerful the proper management of Stacking Contexts really is.
(source:https://dzhavat.github.io/2021/02/18/debugging-layout-repaint-issues-triggered-by-css-transition.html. Credits to the author: Dzhavat Ushev)
The credit for this example goes to the author, Dzhavat. I thought it was really interesting and exactly what I wanted to show you. I recommend visiting his site and checking out his posts.
Final thoughts
So, what we can take away, what conclusions we can draw from what we have learned here?
1. Business value is not the only thing that’s important
The value of a project isn't only determined by its functionality or by the fact that it works as intended. As developers, we should strive not only for functionality, but also for optimal performance. We should develop a passion for and take pride in building well-optimized solutions that function smoothly under the hood.
2. Don’t go too hard on the browser
Browsers are designed to optimize rendering efficiently. However, they could use every bit of help from us. By organising our code and read/write operations logically and coherently, we can assist the browser in its optimization efforts. Awareness and understanding of the topics we've covered today can enable us to be better, more mindful developers, capable of making informed and deliberate decisions in our day-to-day work.
The gains in performance and efficiency relating to the rendering cycle can vary significantly depending on the specific case, problem scale, and complexity of our site. As we saw in the example of the button with the animated background, the optimal solution isn't always obvious at first glance.
3. Question and test everything
Develop a habit of testing and cultivate a thirst for knowledge. The next time you're using properties that trigger a layout or doing any day-to-day task, take a moment to consider how it will impact the page rendering cycle.
4. Sometimes more code is better
Lastly, remember that more code doesn't always mean worse performance. A common misconception among developers is that shorter code is always better. However, as we've seen today, this isn't necessarily the case. Both from the standpoint of readability and performance in the context of page rendering, longer code can sometimes be the better option.
<Contact Us/>
Got a project? Let’s talk!
<Careers/>